
Electoral Bonds Data Explained: 2019-20 | Graphical Representation
Electoral Bonds Data Explained | Here is a detailed graphical description of the Electoral Bonds-related data provided by the State Bank of India (SBI) and subsequently made public by the Election Commission of India (ECI) on its website. We are presenting you with a graphical representation of the data related to 2019-20.

Electoral Bonds Data Explained
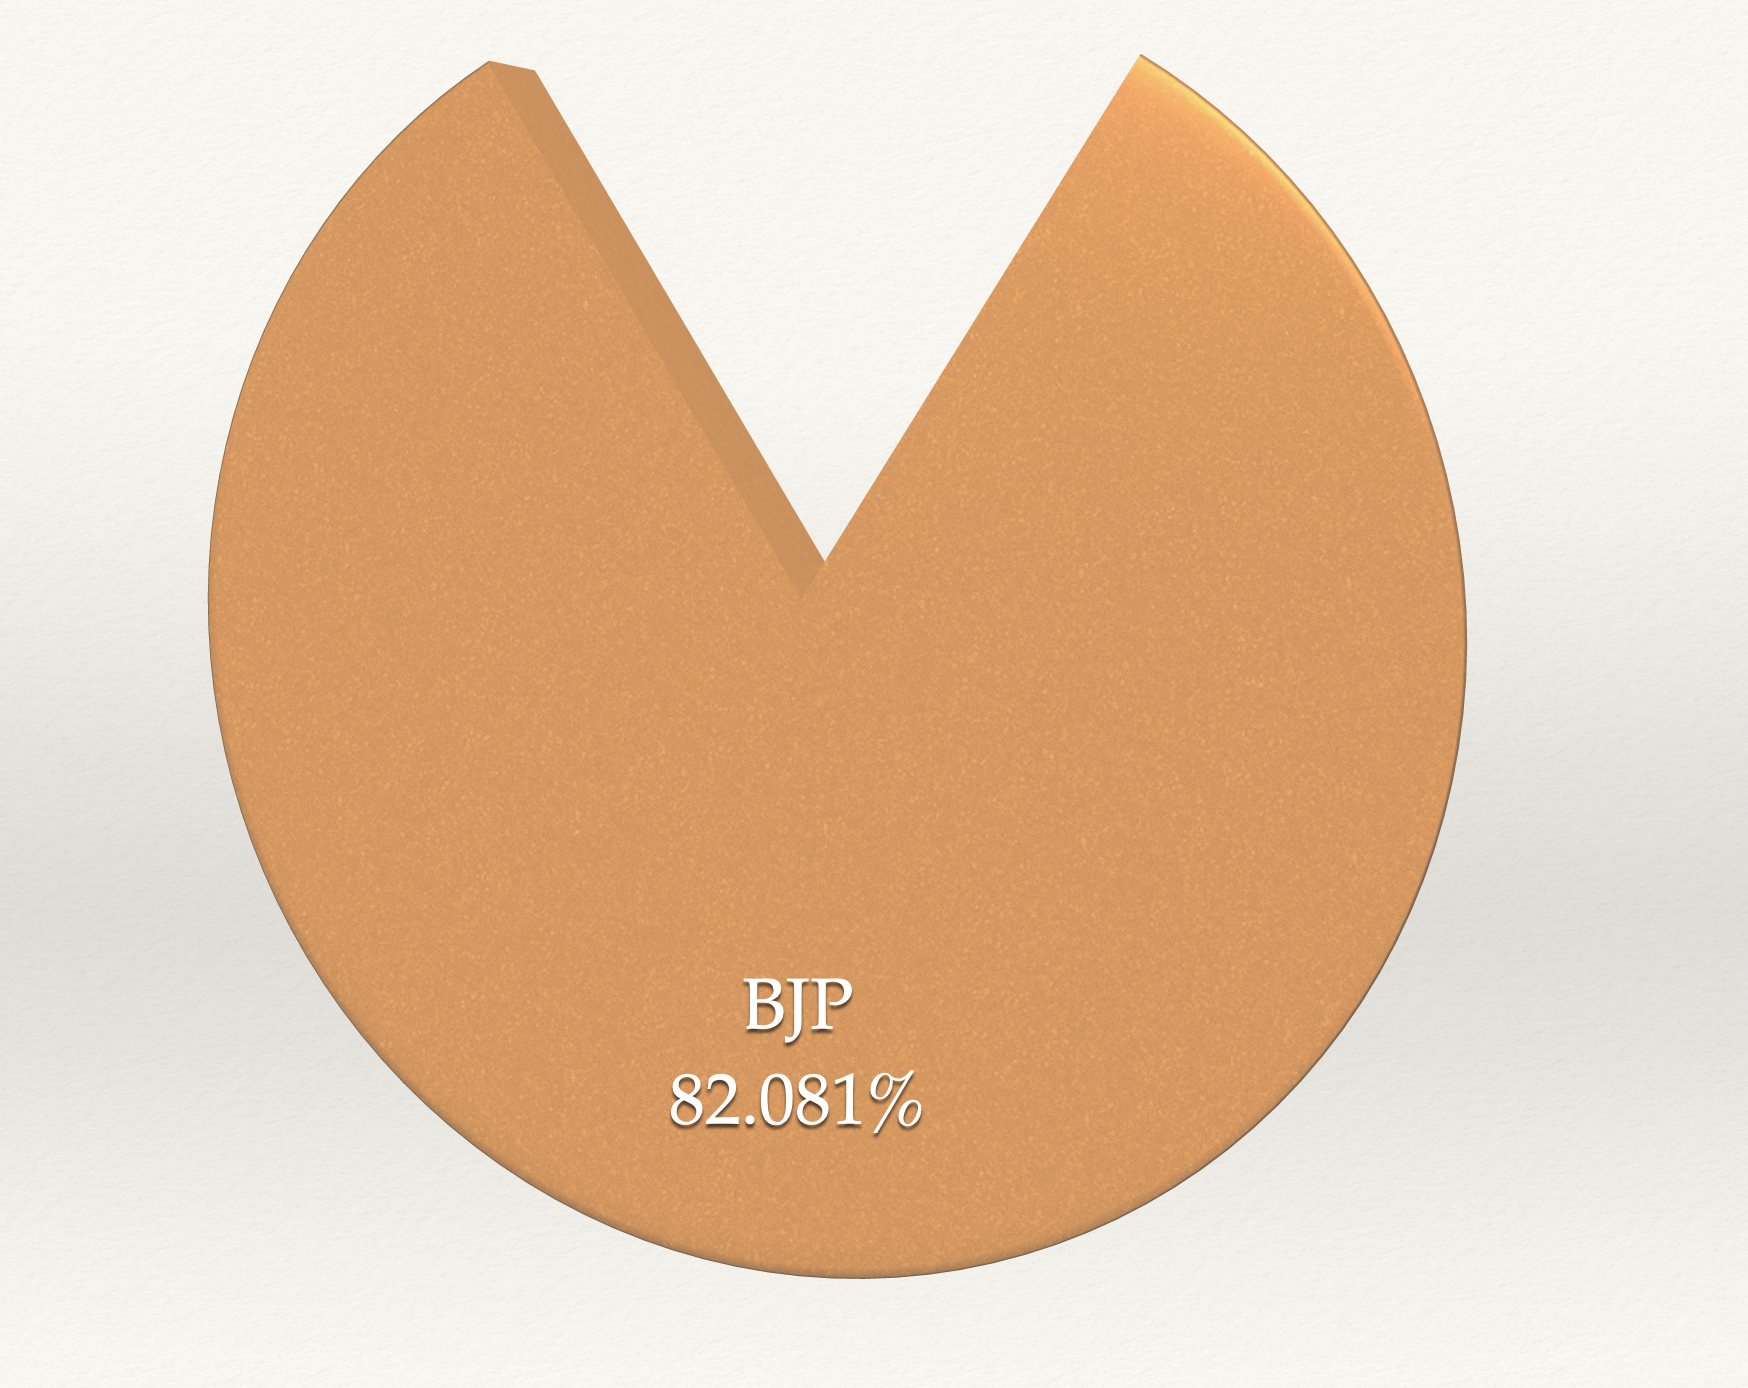
Data as provided by the SBI to the ECI | Graphical Representation by The Probe
Next Story